Axis properties and settings
jqxChart has two main types of axes - valueAxis and xAxis. Typically the valueAxis represents the vertical axis in the chart although you may choose to rotatethe axes and in this case the valueAxis will be displayed horizontally.
Please take a look at the following picture to learn more about the different elements of the axes:
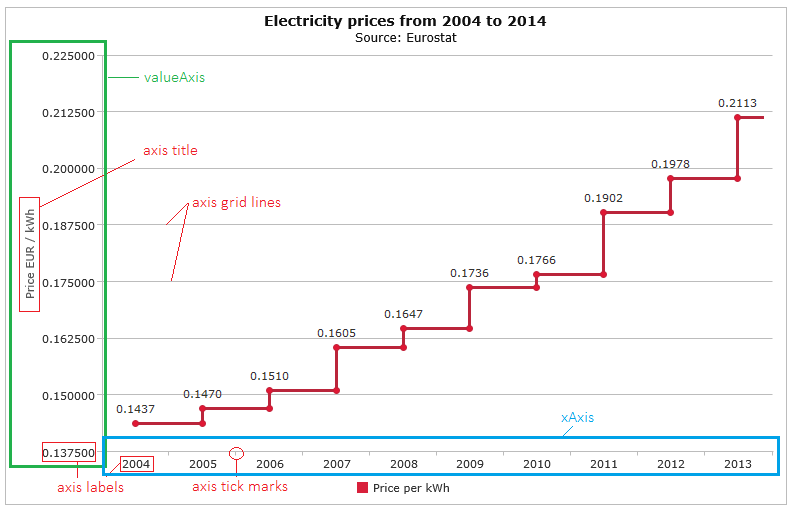
The labels displayed along the valueAxis are derived from the values of the series displayed in the chart. The labels along the xAxis are derived from the values of the 'dataField' property in your data source. In case you don't specify a dataField property, the xAxis will show sequential numbers corresponding to each record in the data source.
Common axis properties
Both the valueAxis and the xAxis have a set of common properties and settings. Most of the properties are optional and if you don't change them jqxChart will use default settings.Here is a list of the common properties that you may change:
- visible - a boolean determining whether the axis is visible.
- minValue - sets the minimum value of the axis. If not set the chart will use the maximum value from the data source.
- maxValue - sets the maximum value of the axis. If not set the chart will use the minimum value from the data source.
- unitInterval - an integer value which determines the interval between the values along the axis. If not set the chart will automatically calculate the size of the interval. The algorithm will try to ensure that all labels, grid lines and tick marks fit well depending on the size of the axis and the total number of data points.
- axisSize - an integer which determines the size of the axis. This property is optional as the chart can automatically calculate the required size.
- flip - specifies whether the values are displayed in reverse order.
- position - determines the position of the axis.
- left - the axis will be displayed on the left side of the chart. This is applicable to valueAxis (or xAxis in case of axis rotation).
- right - the axis will be displayed on the right side of the chart. This is applicable to valueAxis (or xAxis in case of axis rotation).
- top - the axis will be displayed at the top of the chart. This is applicable to xAxis (or valueAxis in case of axis rotation).
- bottom - the axis will be displayed at the bottom of the chart. This is applicable to xAxis (or valueAxis in case of axis rotation).
- padding - determines the left, right, top and bottom padding of the axis.
- left - integer representing left padding of the axis. It's applicable to vertical axes.
- right - integer representing right padding of the axis. It's applicable to vertical axes.
- top - integer representing top padding of the axis. It's applicable to horizontal axes.
- bottom - integer representing bottom padding of the axis. It's applicable to horizontal axes.
- title - a collection of properties describing how to display the title of the axis.
- visible - a boolean determining whether the title is visible.
- text - a string representing the text of the axis title.
- class - a string representing the CSS class of the axis title.
- horizontalAlignment - horizontal alignment of the axis title. Valid values are 'left', 'center', 'right'.
- verticalAlignment - vertical alignment of the axis title. Valid values are 'top', 'center', 'bottom'.
- labels - a collection of properties describing how to display the labels along the axis.
- visible - a boolean determining whether the labels is visible.
- step - an integer value which determines the labels' intervals step.
- class - a string representing the CSS class of the axis labels.
- formatSettings - settings used to format the labels.
- prefix - a string that will appear at the begining of the text.
- sufix - a string that will appear at the end of the text.
- decimalSeparator - a symbol used to mark the border between the integer and fractional part of a number.
- thousandsSeparator - a symbol used to mark the border between thousands, millions, billions, etc.
- decimalPlaces - the number of digits displayed after the decimal separator.
- negativeWithBrackets - a boolean value indicating whether to display negative numbers in brackets.
- formatFunction - callback function used to format the labels.
- angle - an integer representing the labels rotation angle in degrees.
- rotationPoint - position to rotate the text around, e.g. 'lefttop', 'leftcenter', 'leftbottom', 'centertop', etc.
- horizontalAlignment - horizontal alignment of the axis labels. Valid values are 'left', 'center', 'right'.
- verticalAlignment - vertical alignment of the axis labels. Valid values are 'top', 'center', 'bottom'.
- offset - custom horizontal and vertical labels position offset, e.g. {x: 5, y: 2}
- autoRotate - a boolean which determines whether to enable automatic labels rotation. This property is applicable to pie, donut, polar and spider charts.
- gridLines - a collection of properties describing how to display the axis grid lines.
- visible - a boolean determining whether the grid lines are visible.
- step - an integer value which determines the the grid lines' interval step.
- color - a string representing color of the grid lines.
- lineWidth - an integer representing the line width of the grid lines. The default value is 1.
- dashStyle - a string sequence of numbers represening line and space lengths, e.g. '2,2'.
- tickMarks- a collection of properties describing how to display the axis tick marks lines
- visible - a boolean determining whether the tick marks are visible.
- step - an integer value which determines the tick marks' interval step.
- color - a string representing color of the tick marks lines.
- size - an integer representing the size of the tick marks. The default value is 4.
- lineWidth - an integer representing the line width of the tick marks. The default value is 1.
- dashStyle - a string sequence of numbers represening line and space lengths, e.g. '2,2'.
- line - a collection of properties describing line of the axis
- visible - a boolean determining whether the axis line is visible.
- color - a string representing color of the axis line.
- lineWidth - an integer representing the width of the axis line. The default value is 1.
- dashStyle - a string sequence of numbers represening line and space lengths, e.g. '2,2'.
- alternatingBackgroundColor - alternating background color between grid lines.
- alternatingBackgroundColor2 - second alternating background color.
- alternatingBackgroundOpacity - opacity of the alternating background.
xAxis specific properties
There are several properties which are applicable only to the xAxis:- type - the type of the xAxis. Values can be:
- 'default' - auto detects and switches to 'basic', 'linear' or 'date'
- 'date'- when displaying dates
- 'basic' - displays all data points sequencially
- 'linear' - linear arrangement by the value of the category axis data field
- baseUnit - the base unit when used with 'date' axis. Values can be 'year', 'month', 'day', 'hour', 'minute', 'second' or 'millisecond'.
- valuesOnTicks - specifies whether the axis values will be aligned with the tick marks.
- dataField - name of the field in the data source. The values of this field will be displayed along the axis.
- displayField - This field is optional and it is used in the preparation of the default tooltips text.
- rangeSelector - definition of a range selector on the xAxis. For more details check the rangeSelector help topic and examples.
valueAxis specific properties
Similarly several properties are applicable only to the valueAxis:- baselineValue - an integer representing the baseline value for the axis. The default value is 0.
- logarithmicScale - a boolean representing whether to use logarithmic scale. The default value is false.
- logarithmicScaleBase - an integer representing the base of logarithmic scale. The default value is 10.